Evaluation Toolkit Case Study (Tool 11 – Post Event Surveys)
With thanks to Dr Mark Fuller, UCL, for this contribution
The event
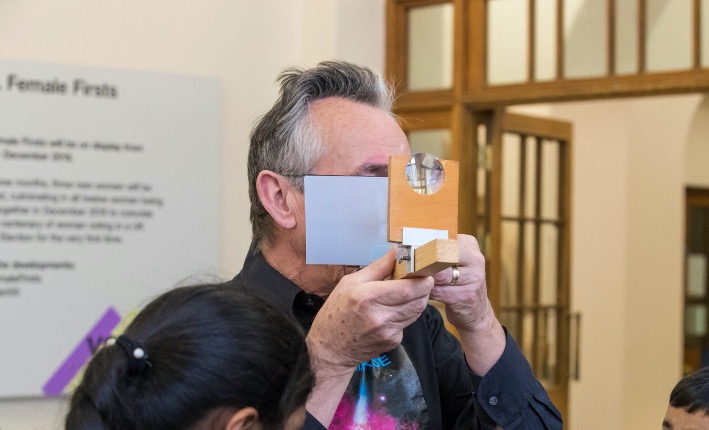
The Your Universe festival is a three day event (Thursday-Saturday) with schools invited to morning and afternoon slots on the first two days and open to the general public on the Saturday afternoon. The aim is to use space as a tool to help inspire minds to take an interest in physics.
What we did
Data collection
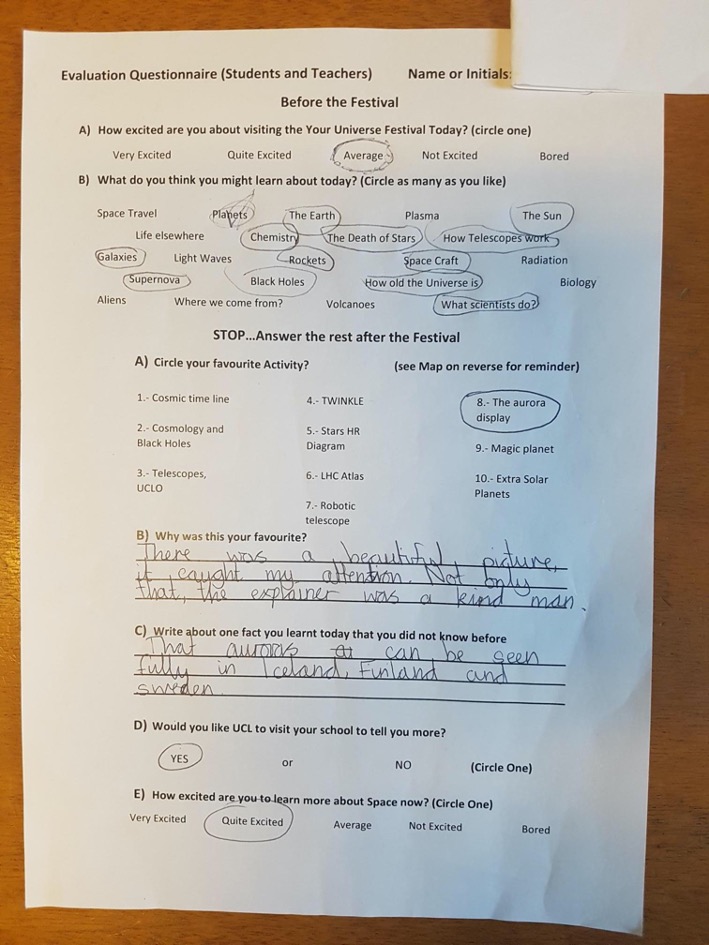
We collected our data using paper surveys (see our post-event questions file for a copy of the site map and questionnaire that was provided to Your Universe visitors). When possible, pupils completed the first two questions before the festival, which were designed to assess their baseline level of engagement and what they expected to find. After participating in the festival but before leaving they then completed the rest of the survey, which enquired about which parts of the festival they enjoyed and why, facts they recalled and a gauge of excitement about learning more.
Data collection with the public audiences (Saturday) was more limited. We took a head count every 30 minutes, with the age range roughly gauged using a tally chart. We then asked five groups who seemed to roughly match the age distribution to complete the survey questions (verbally).
In addition, we asked festival volunteers and teachers to submit their feedback after the event via an online questionnaire.
Data analysis
We used an Excel spreadsheet (see post-event feedback for details) to enter our data, with one row for each respondent. The first seven columns correspond to pre-event questions A and B and post-event questions A-E. Responses to open-ended questions (post-event questions B and C) were entered by hand. Columns M-Q were used to count and calculate the percentages of students responding to pre-question A about how excited they were before the festival. Finally, Columns S through AB were used to analyse post-event question A, with one column for each possible response (Cosmic time line, Cosmology and black holes, etc). A formula was used to populate the columns, and then to sum the total number of students reporting each activity as their favourite.
What we found out
To our knowledge, this was the first time that evaluation data had been collected in any sort of systematic way for Your Universe. The constant gentle reminder to fill in the evaluations meant that we had an almost 65% return of evaluations, and this proportion was even higher when just considering primary school children.
Far less successful were the post event evaluations sent to the teachers and volunteers, which received only four replies, three from teachers (33% return) and one from a volunteer (out of ten volunteers). Although these are useful as case studies, it is difficult to assess the impact of making changes to timings and structure of the festival based on such a small number of responses.
At the beginning of the festival, students were clearly excited, with 40%, 35% and 25% reporting ‘Very’, ‘Quite’ and ‘Average’ levels of excitement, respectively (pre-event question A). None responded that their excitement levels were ‘not excited’ or ‘bored’.
Although the questions were not worded in the same way (so comparisons must be made cautiously), if we consider pre-event question A and post-event question E as indicative of excitement, we can compare levels of excitement at the beginning and end of the event. Only four reports show a drop in the level of excitement, whereas 19 showed a rise. The remainder showed no change but it should be noted that 17 were ‘very excited’ at the beginning and end, so no further increase could be measured.
The most popular events seemed to fall into either interactive demonstrations (such as Telescopes and Cosmology) or sit-down presentations (such as Aurora Borealis and Exo-Planets). Looking at students’ responses to the open-ended questions, it appears that a mixture of learning something new and the personality of the speaker were the most inspiring aspects.
Reflections on using the post-event survey
In the future I would like to investigate ways of capturing more information digitally, as logging responses to paper surveys was very time-consuming. I have used Plickers at other events, which provides data immediately. The return rate also drops dramatically when people take the surveys away with them or are sent digital copies later.
If I were to change the survey, I would consider using fewer open questions, but I would also want to avoid stifling opinions that I had not considered, or influencing or biasing responses by providing too narrow a range of options. I would also reinstate a question (that was removed due to lack of space on the paper copy) about which keywords pupils DID learn about. Making far more use of the pre-event question, ‘What are you expecting to learn about today?’ would also allow a better analysis of the overall impression that the festival left.
Back to Tool 11 – Post Event Survey page
