Create your own sky map, find the weirdest stars and explore the surface of the Moon with the EXPLORE astronomy toolkit
EXPLORE Project Press Release
A new set of tools for astronomers and planetary explorers use interactive visual analytics and machine learning to reveal and contrast properties of objects in our galaxy. From identifying the ‘weirdest’ outliers in a population of stars to creating maps of the dusty Milky Way, or combining datasets for an immersive exploration of the lunar surface, the open-source tools are designed to help astronomers investigate, annotate and work together on interesting results in a collaborative online environment.
The EXPLORE toolkit, which has been developed with funding from the European Commission’s Horizon 2020 programme, was presented last month at the Astronomical Data Analysis Software & Systems (ADASS) XXXIII conference and during a technology workshop at the Italian Space Agency’s headquarters.
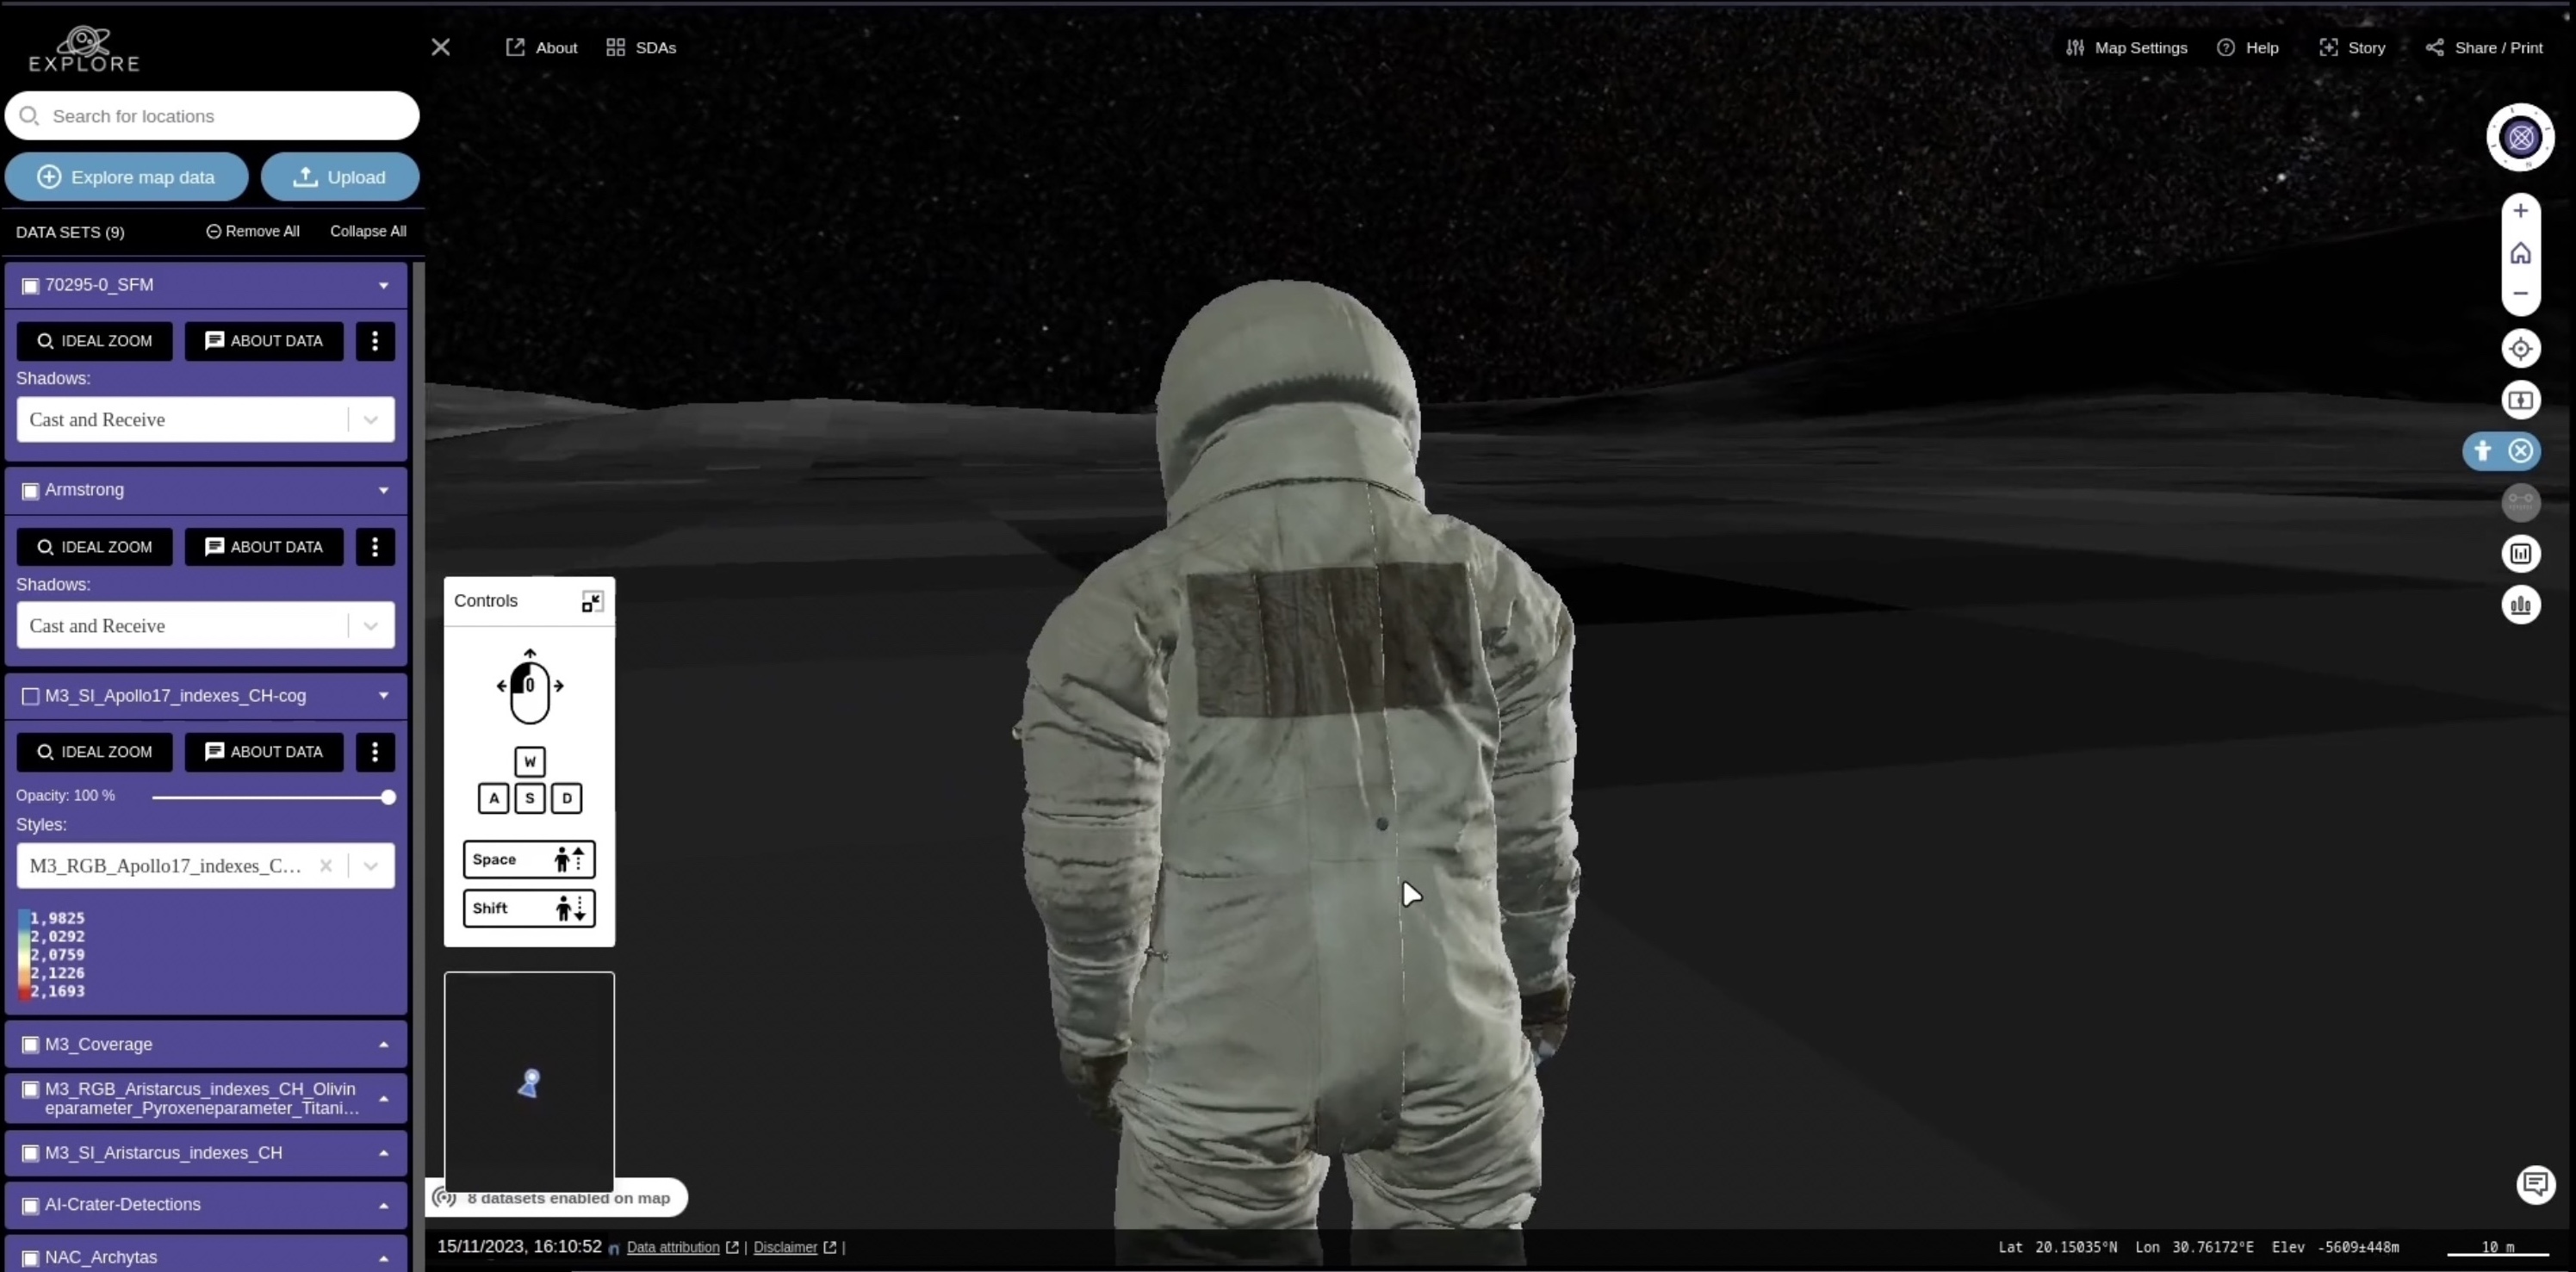
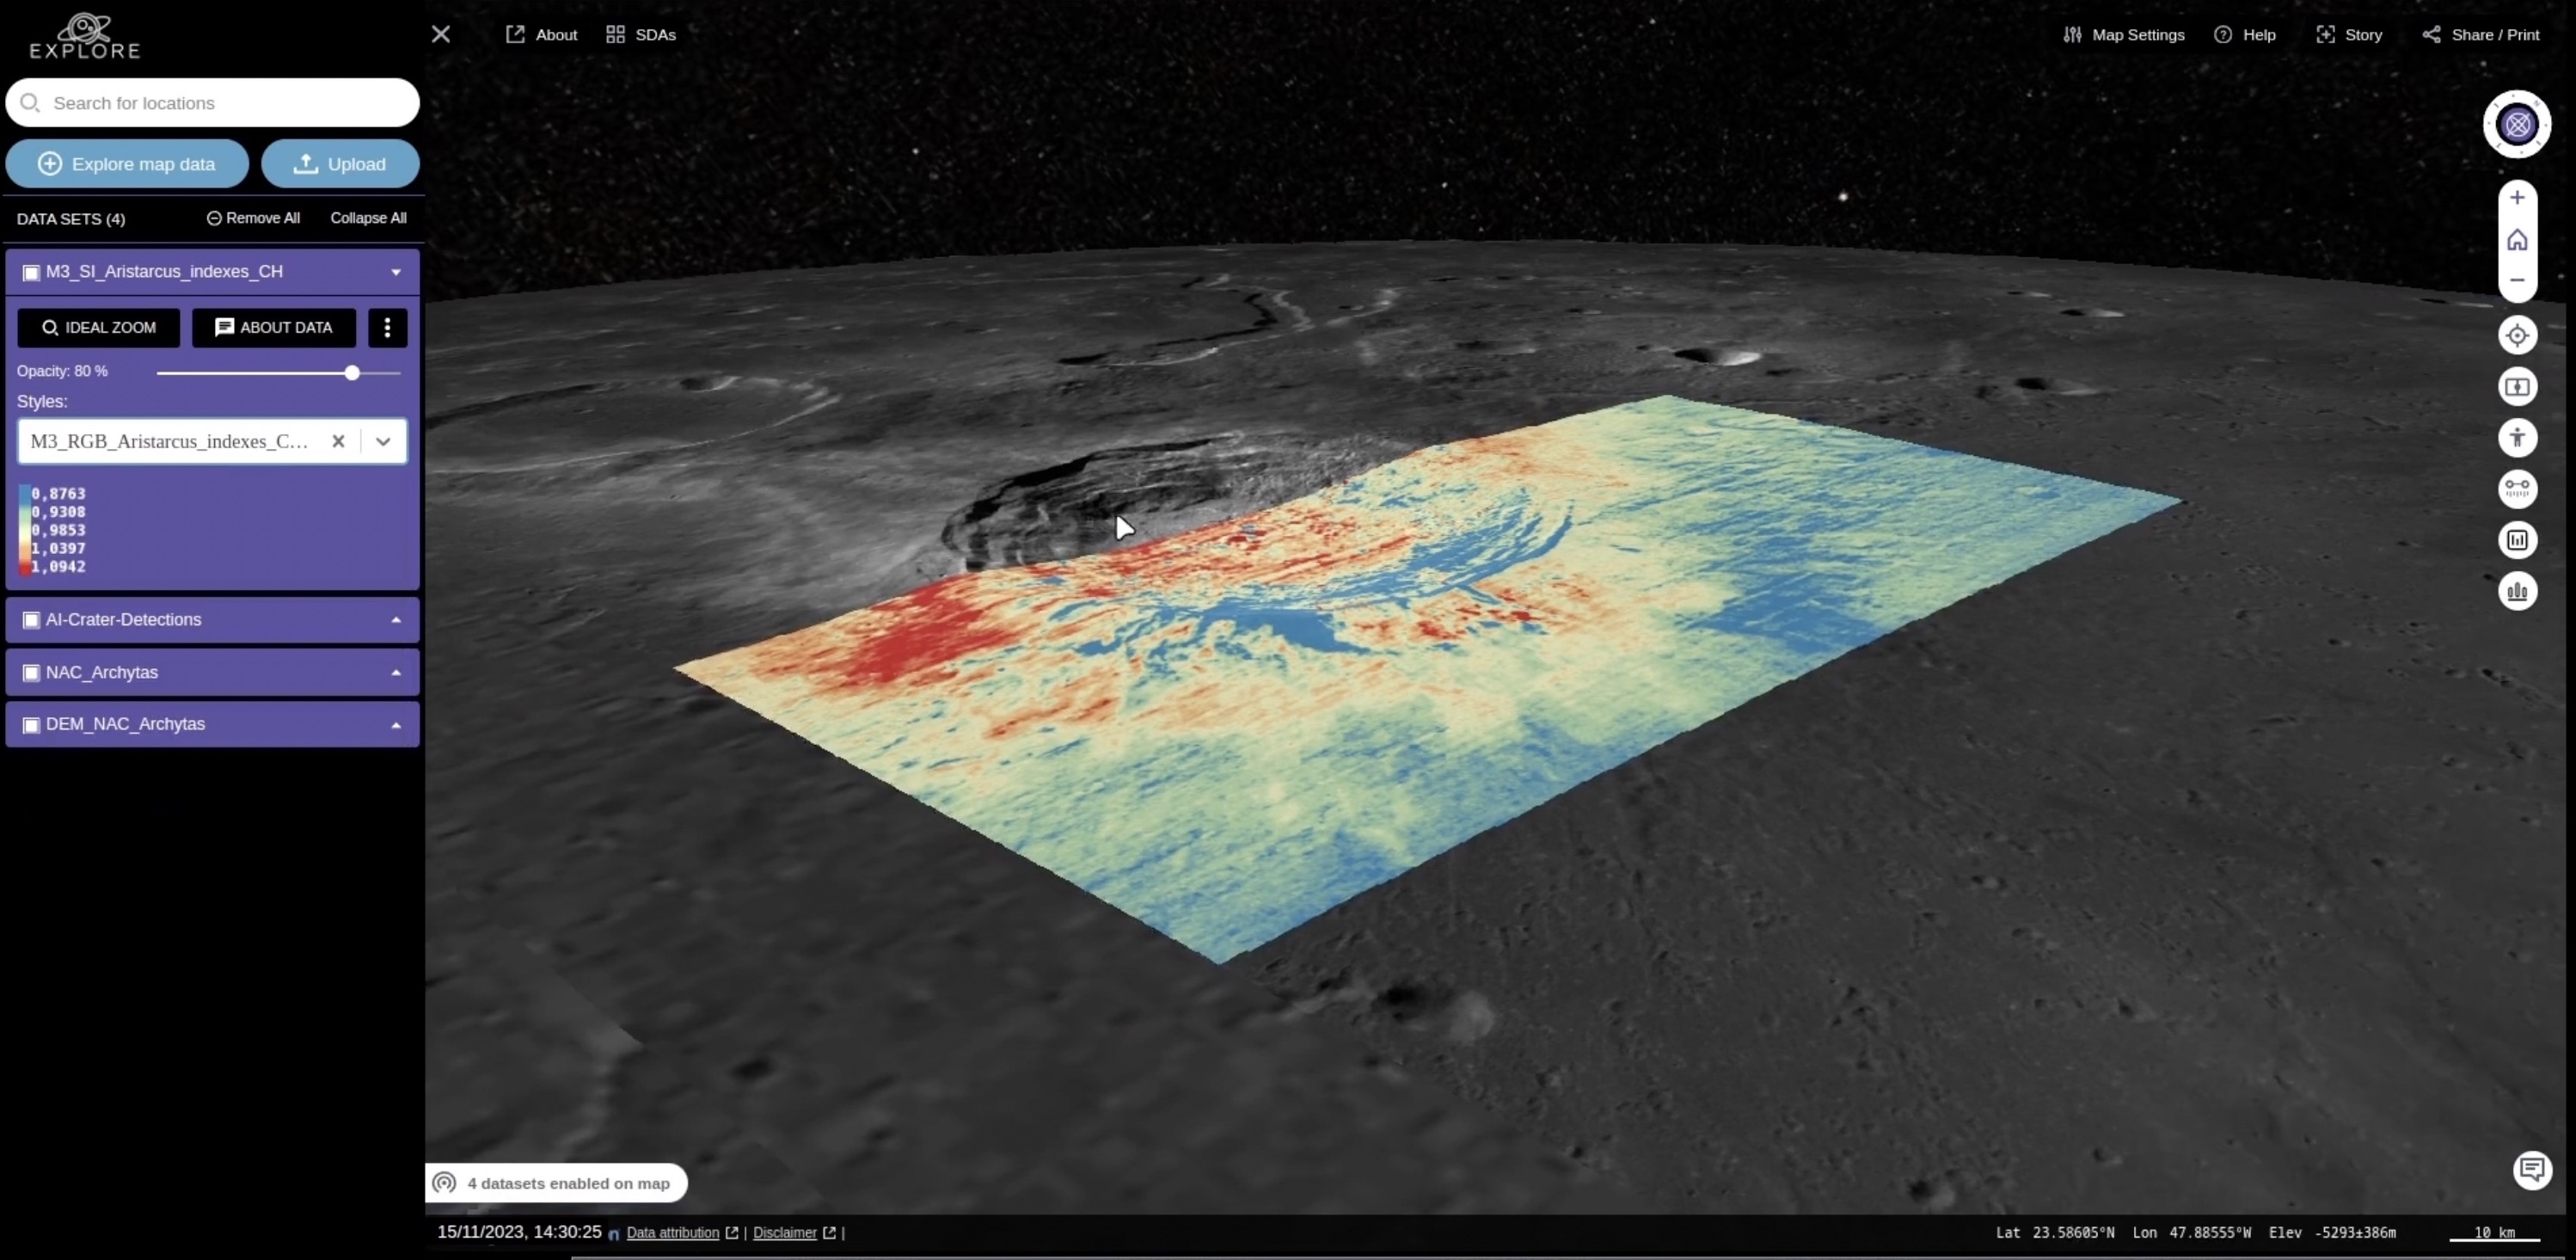
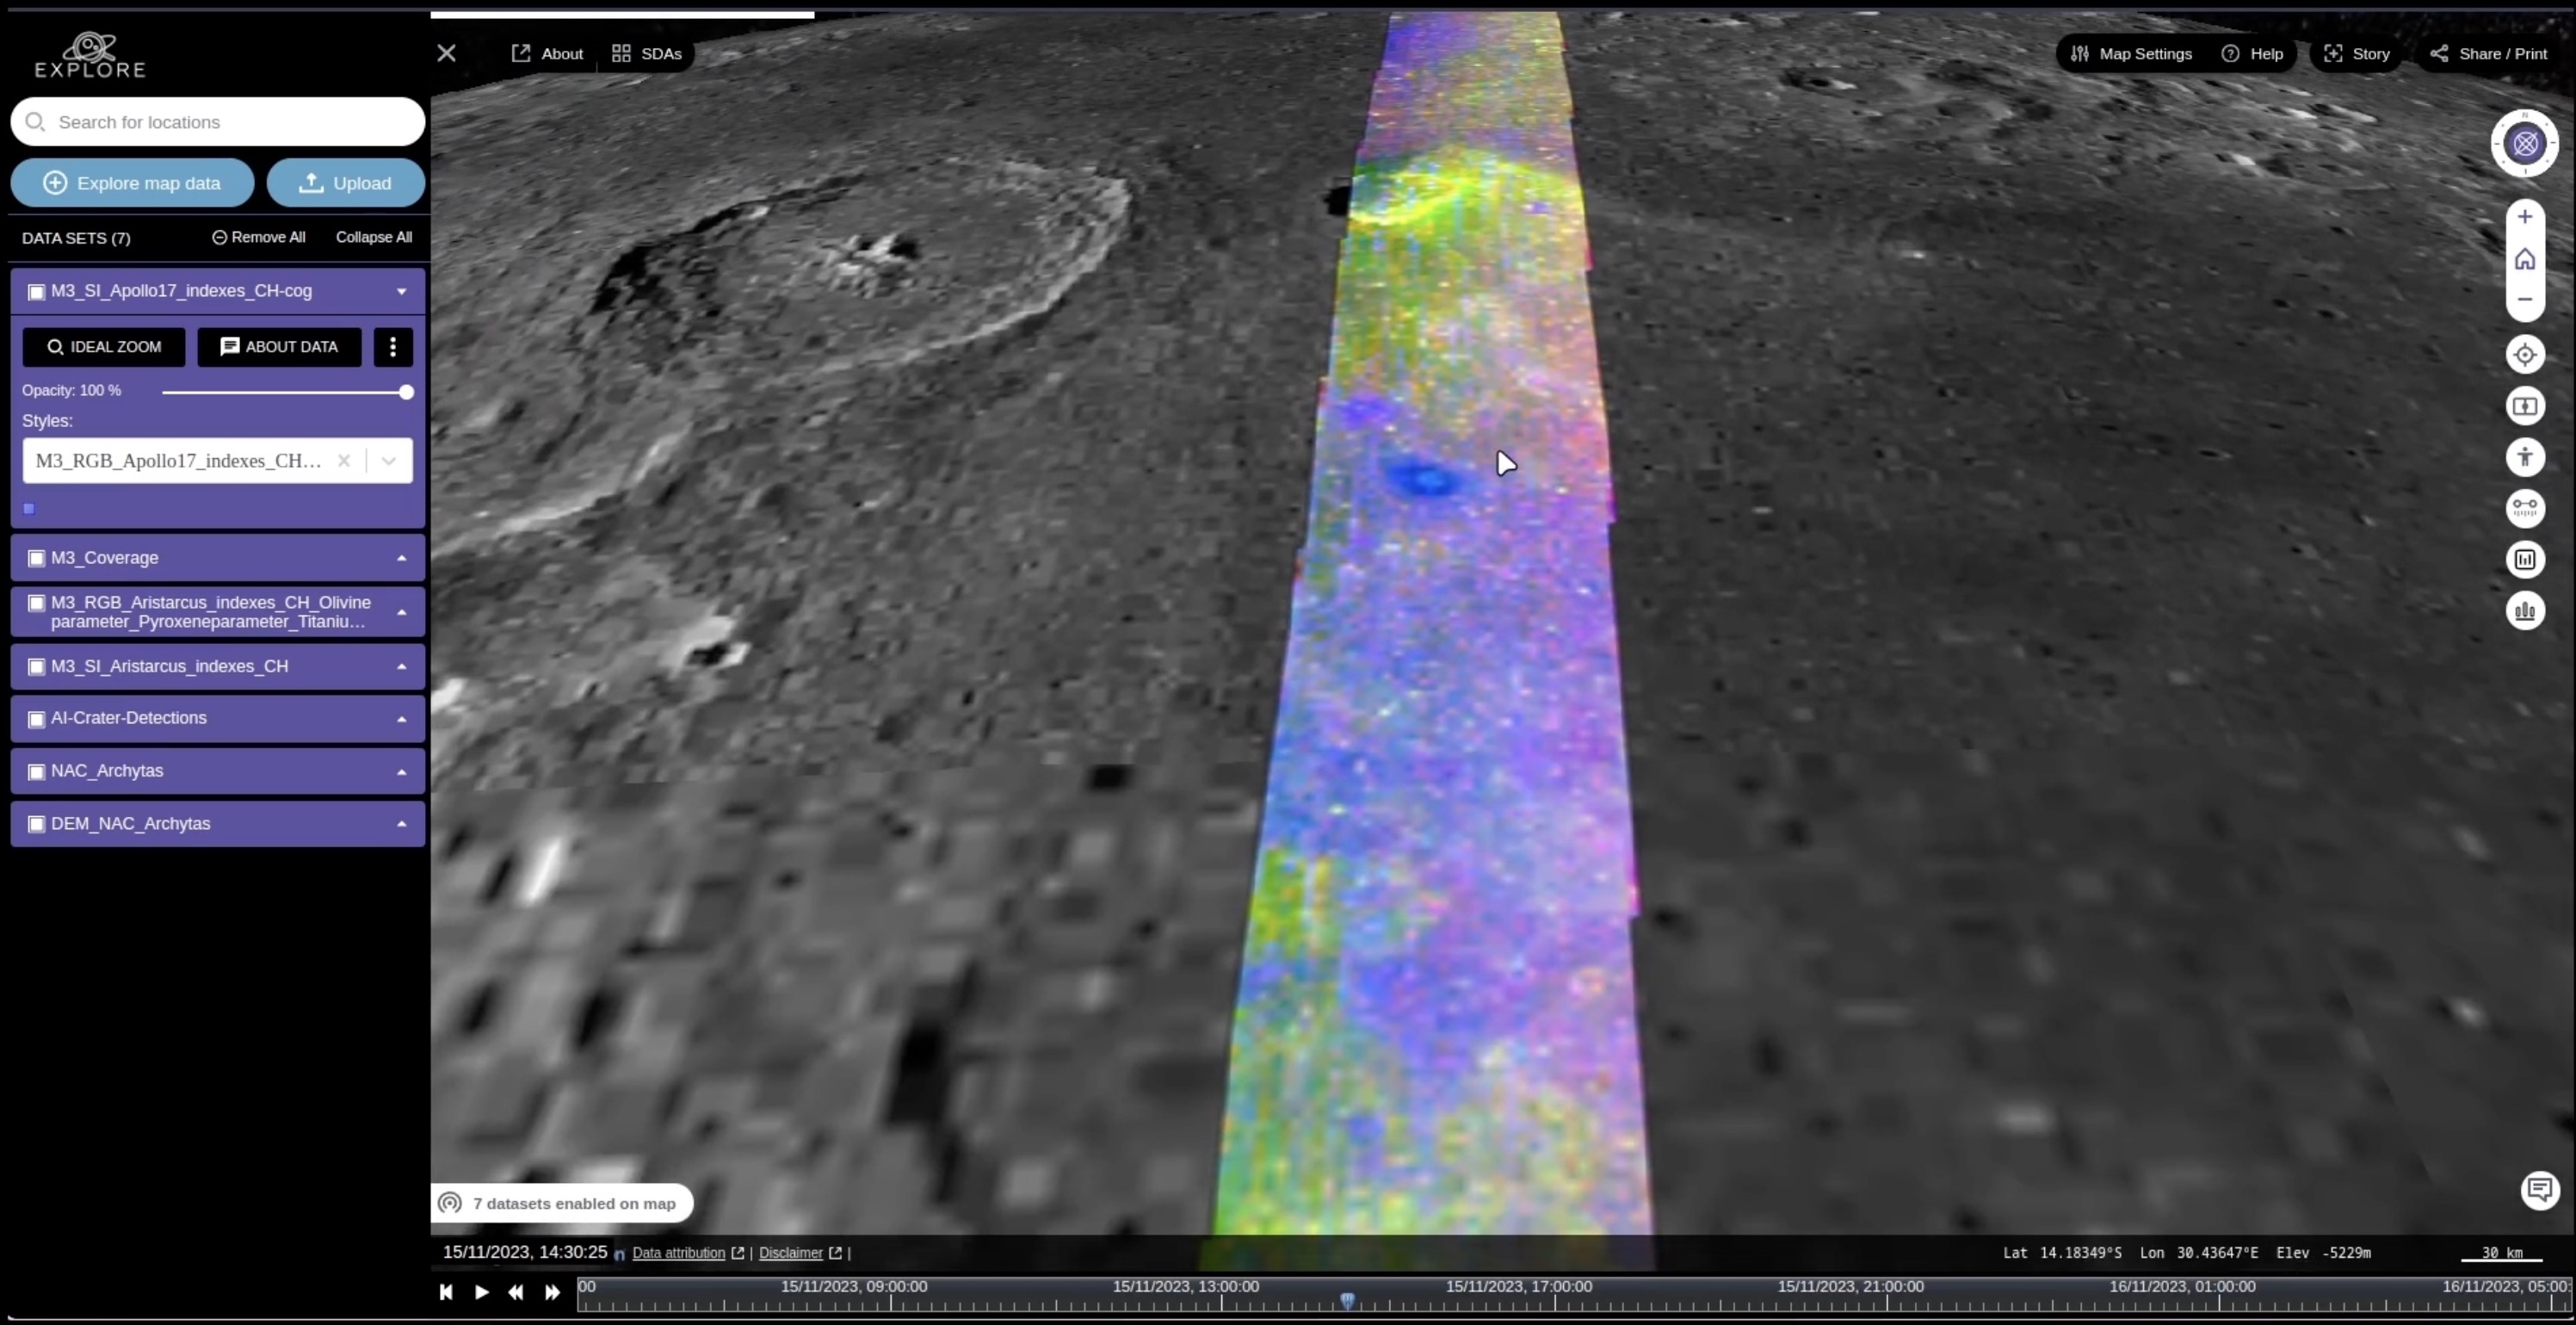
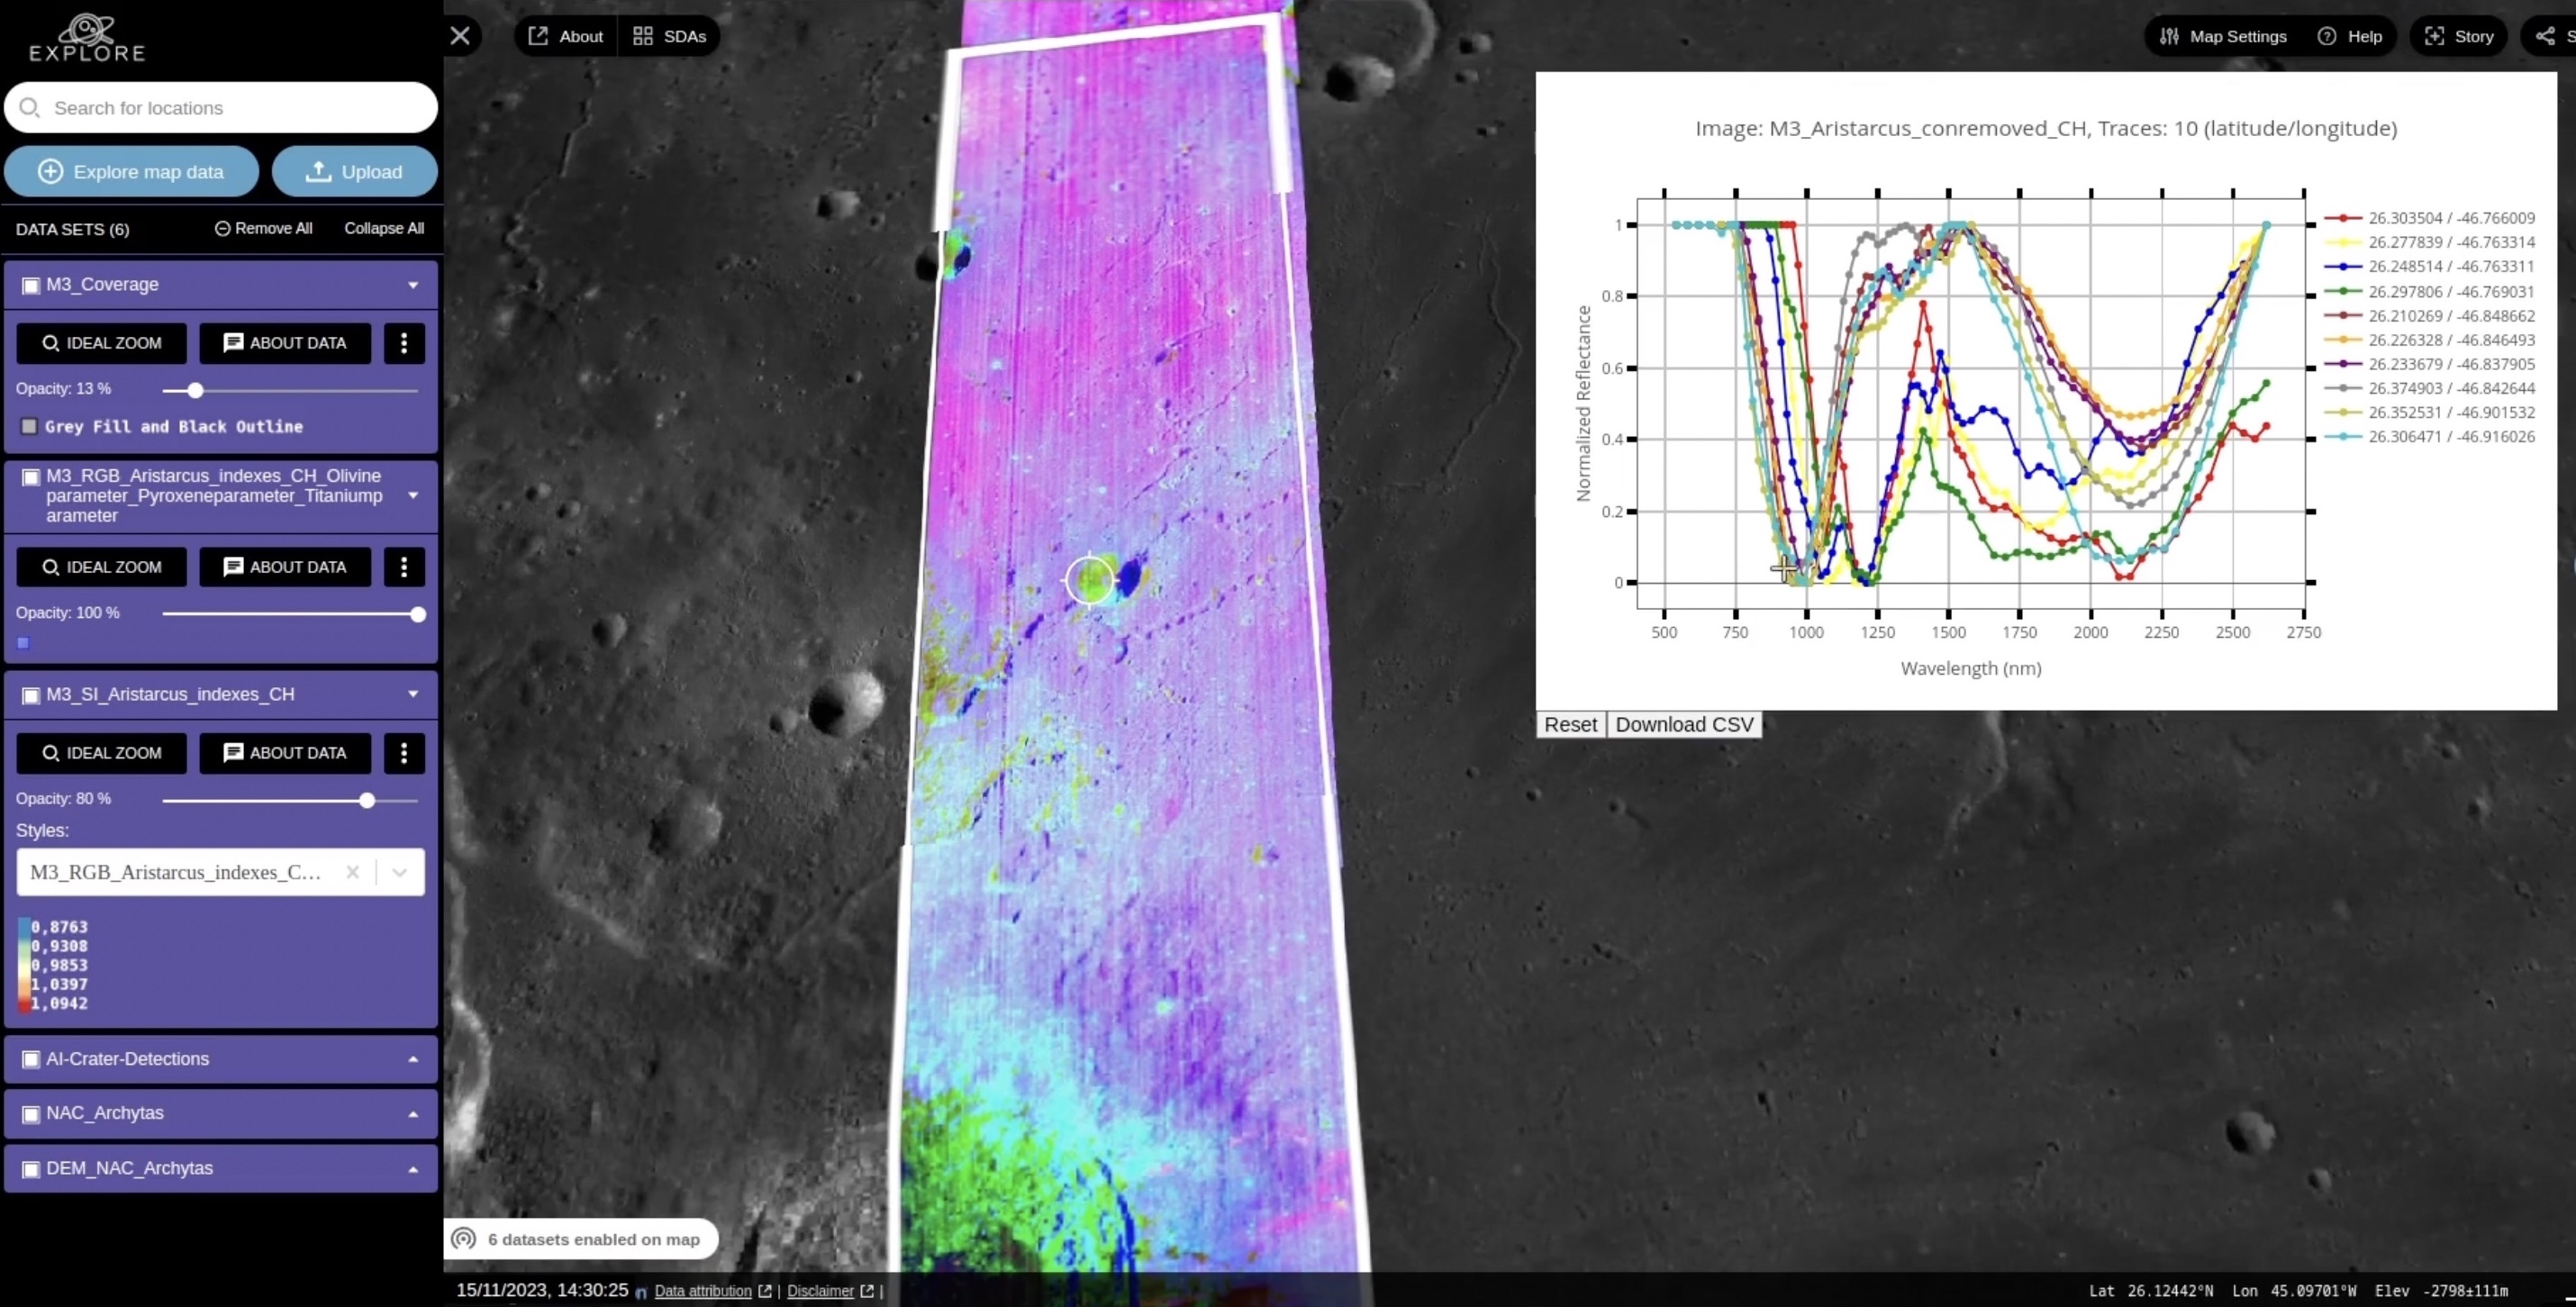
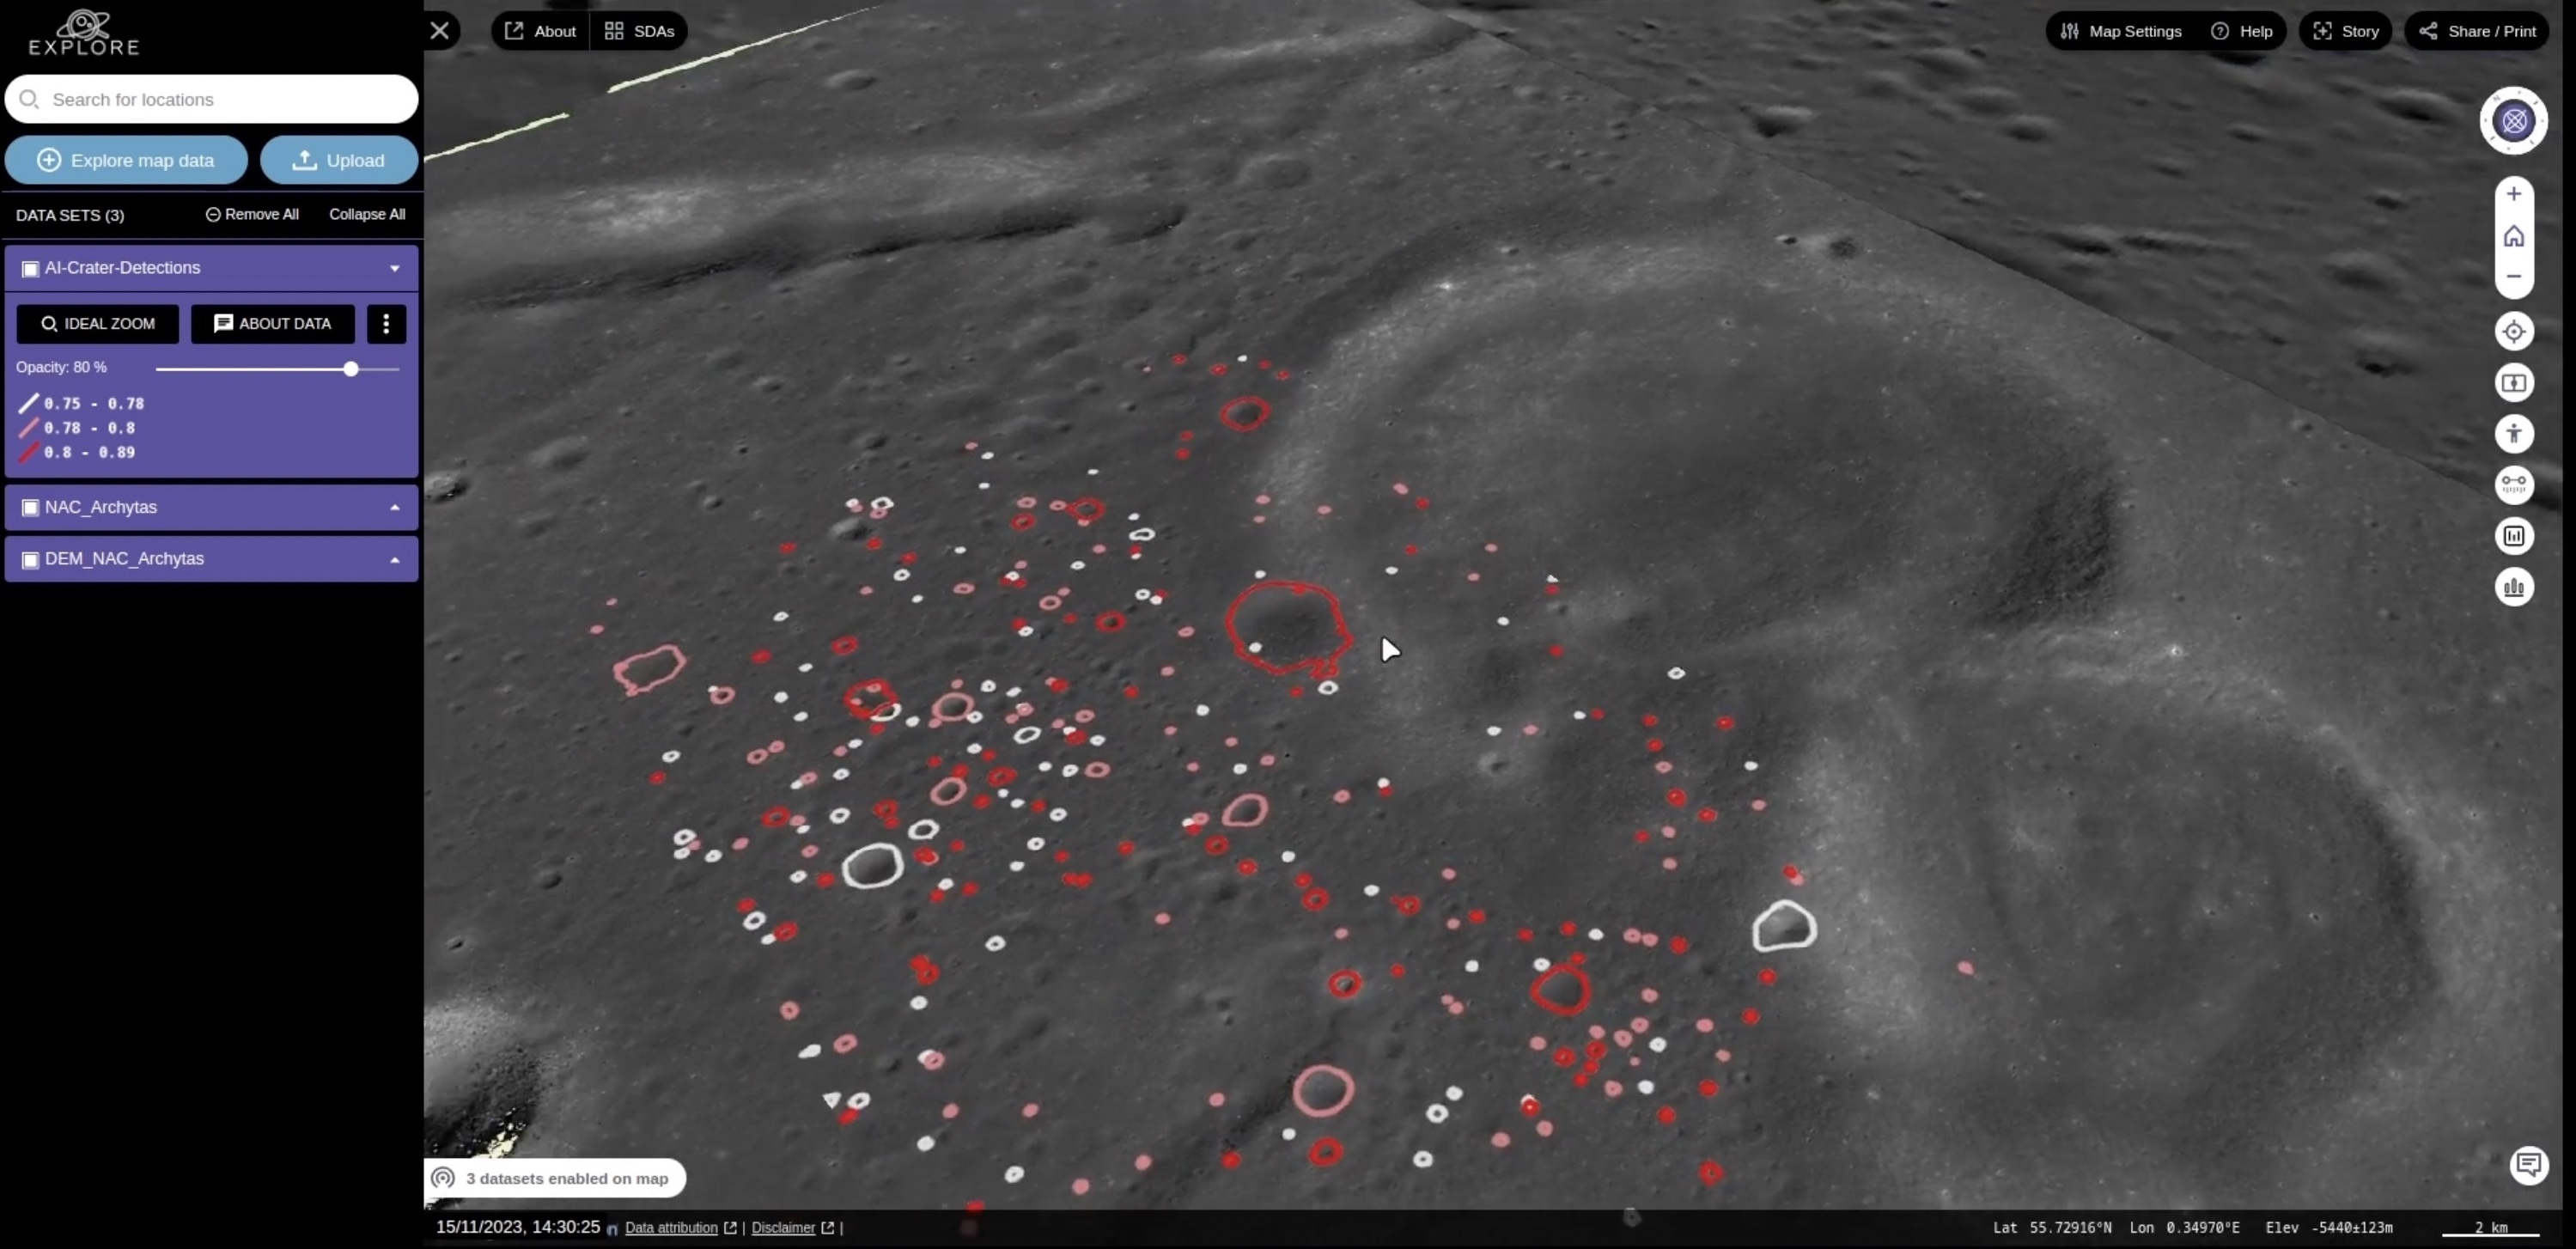
EXPLORE’s lunar tools allow users to navigate a 3D model of the Moon and upload, display and compare multiple datasets from lunar missions. Zooming in on a location, users can overlay basemaps with contours, visualisations at different wavelengths and spectral information on the mineralogy of the surface. Pre-trained deep learning models help identify craters and map features. A ‘pedestrian view’ enables users to visualise themselves standing and moving around the lunar surface through digital elevation models.
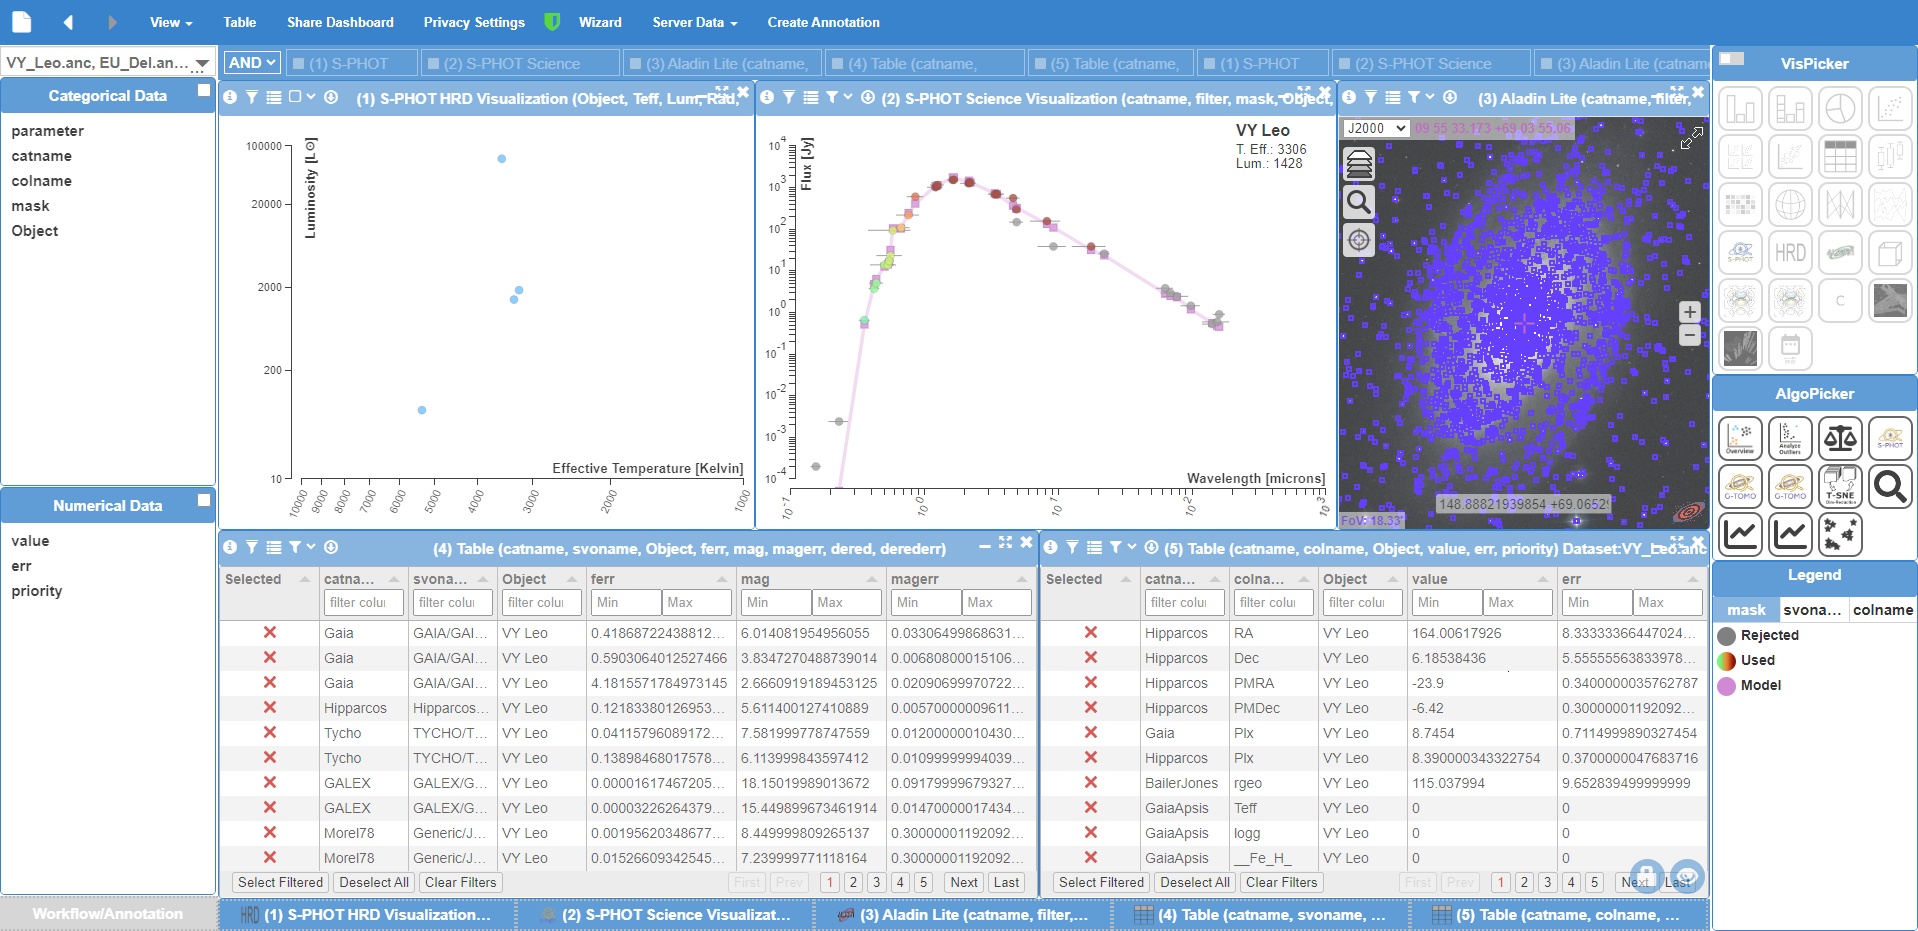
Tools for stellar research are designed to investigate the properties of stars in the Milky Way observed by theEuropean Space Agency’s Gaia mission and in other large databases. Assigning a weirdness score to spectral data can help astronomers find unusual stars, or groupings that have similar characteristics, within a population of a million stars. Comparisons of the brightness of stars at different wavelengths can reveal information on the temperature, age, size and amount of energy stars produce. When applied to a census of all the stars in the Milky Way, these collective results can help unravel the overall composition of our galaxy, and how it was built up.
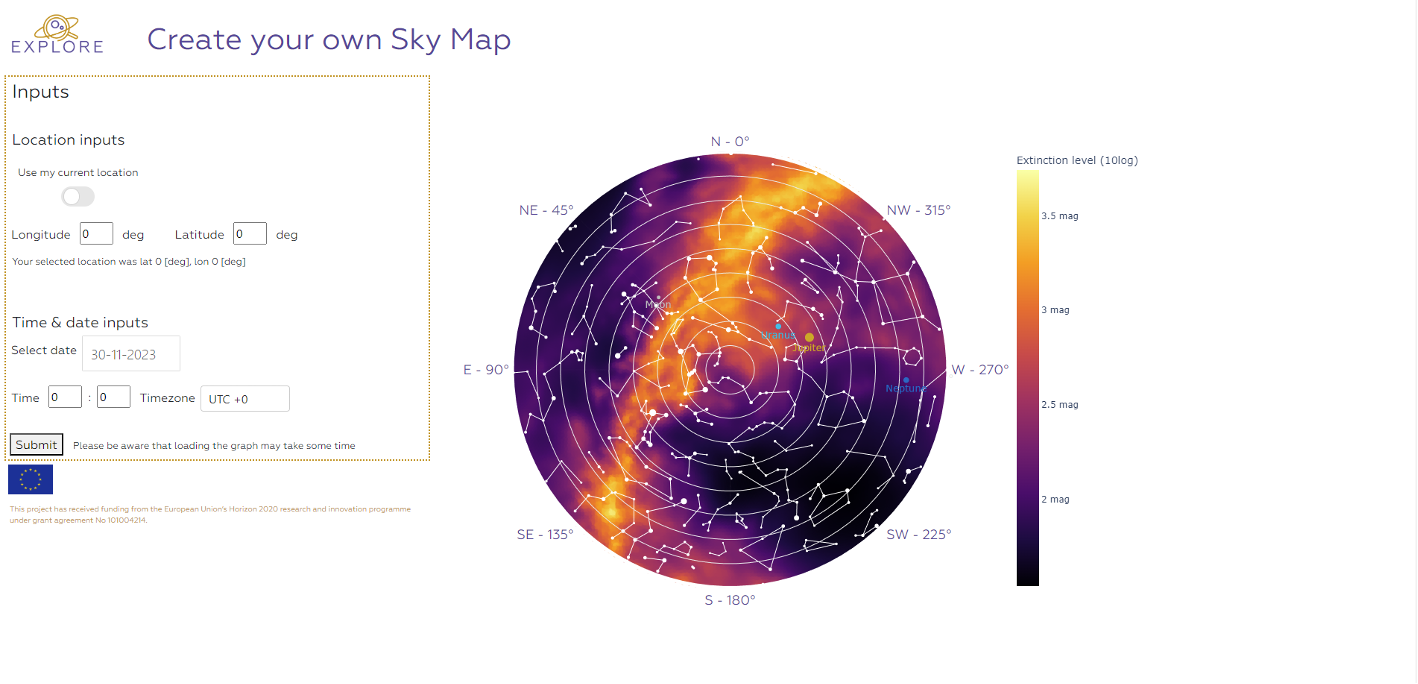
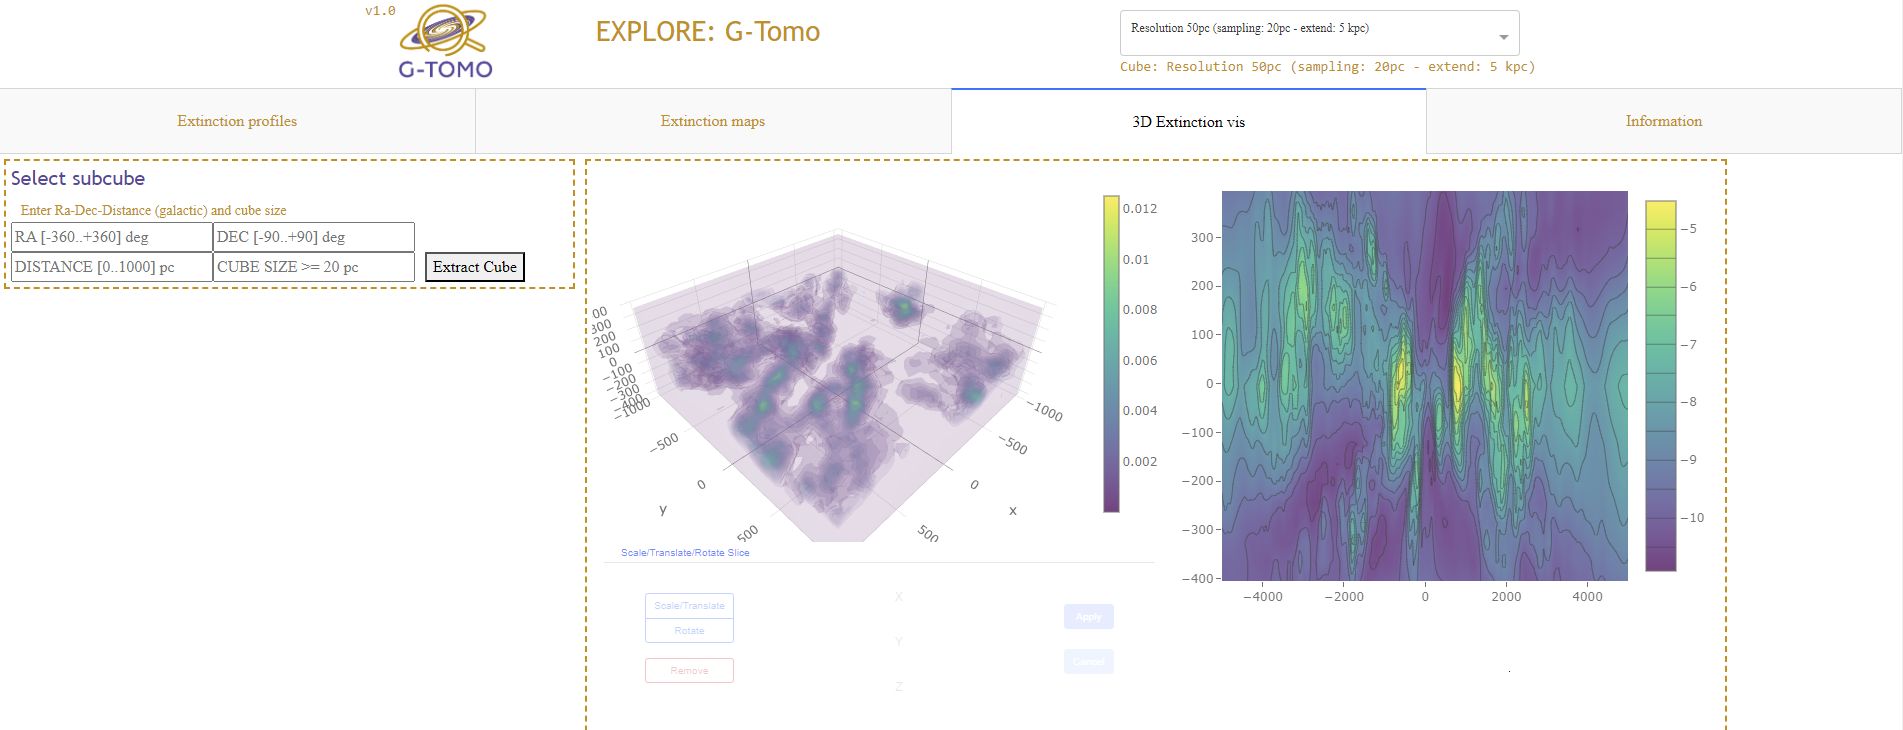
Galactic tools enable users to look at dusty objects and the distribution of dust in the Milky Way in one, two or three dimensions. Slicing through the galaxy in any orientation can reveal where dust is densely clumped and where there are windows that offer potential sightlines to objects of interest. Interactive sky maps show how the dust band at the core of the Milky Way passes overhead through the day and night at any given location on Earth.
Nick Cox, the coordinator of EXPLORE, said: “These EXPLORE science applications are demonstrators for astronomers working in a broad range of fields, including stellar spectroscopy, galactic archaeology and lunar exploration. Both the EXPLORE tools and the platform they are deployed on are very flexible and can be adapted to other areas of astronomy and planetary science.”
Manuela Rauch, of the Know Center, who led the development of the visualisation tools and user interface, said: “Our goal for EXPLORE is to supply methodologies, tools and inspiration for others to create their own web apps and services!”
Giacomo Nodjoumi, of Constructor University, who developed the lunar exploration tools, said: “These new tools for the scientific community are completely open source, modular, expandable and scalable, with no installation required.”
Animations
Full tutorial on using the G-TOMO tool to investigate dust in the Milky Way:
Full tutorial on L-HEX and L-EXPLO tools to explore the surface of the Moon:
Full tutorial on using the S-PHOT tool to investigate properties of stars in the Milky Way:
Full tutorial on using the S-DISCO tool to discover unusual stars in the Milky Way.
Images
Science Contacts
Nick Cox
Coordinator, EXPLORE Project
ACRI-ST
nick.cox@acri-st.fr
Manuela Rauch
Know Center GmbH, Graz, Austria
mrauch@know-center.at
Giacomo Nodjoumi
Constructor University
gnodjoumi@constructor.university
Media Contact
Anita Heward
EXPLORE Communications Manager
Europlanet Media Centre
aheward@europlanet-society.org
About EXPLORE
Innovative Scientific Data Exploration and Exploitation Applications for Space Sciences (EXPLORE) has received funding from the European Union’s Horizon 2020 research and innovation programme under grant agreement No 101004214. https://explore-platform.eu
The six scientific data applications developed by EXPLORE are:
Galactic:
- G-Arch: Galactic Archaeology
- G-Tomo: Interstellar 3D tomography of dust and gas in the Galaxy
Stellar:
- S-Phot: Stars and their blue infrared colour excess: signs of activity and circumstellar material
- S-Disco: Spectral discovery of stars
Lunar:
- L-Explo: Global multi-scale compositional higher-level products for the lunar surface
- L-Hex: Human lunar exploration landing site characterisation and support
EXPLORE is a consortium of seven beneficiaries:
- ACRI-ST (France): https://www.acri-st.fr
- Observatoire de la Côte d’Azur (France): https://www.oca.eu/en/
- University of Manchester (UK): https://www.manchester.ac.uk
- Jacobs University (Germany): https://www.jacobs-university.de
- KNOW Center Graz (Austria: https://www.know-center.tugraz.at/en/
- Dill Faulkes Educational Trust (UK): https://www.faulkes.com
- adwäisEO (Luxembourg): https://www.adwaiseo.eu/
Input has also been provided by Tel Aviv University (Israel). Dissemination for EXPLORE is supported by the Europlanet Media Centre: https://www.europlanet-society.org/media-centre/
Follow the hashtag #ExplorePlatform
YouTube channel @ExplorePlatform
