Evaluation Toolkit Case Study (Tool 5 – Geographic location map)
With thanks to Cornwall Sea to Stars for contributing this example.
The event
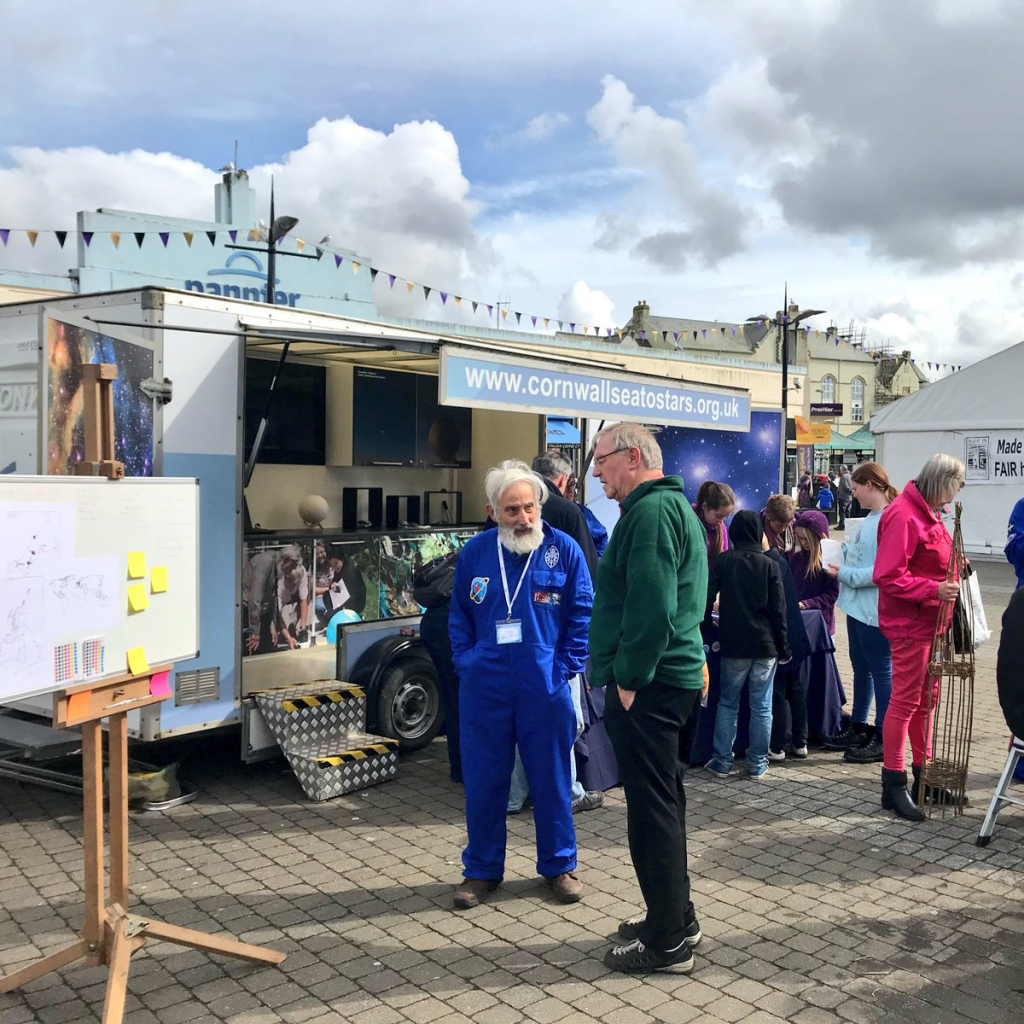
‘Cornwall Sea to Stars’ showcases the astronomy and geophysics intrinsic to and evident throughout the county of Cornwall. The event described here involved a large trailer parked on a public quay over the Easter long weekend. Activities showcased included:
- Solar telescopes
- Binoculars trained on the Cathedral Spire
- Example telescopes
- A badge maker
- A ‘Hunt the Planet’ trail, with “planets” (laminated pictures of planets and information on the radius and comparison to Earth’s radius) hidden around the quay (i.e. secured with plastic ties to benches, posts and other infrastructure).
- Handling samples of meteorites
- Videos
- Globes of planets and moons
- Spectroscopes and light-sources
What we did
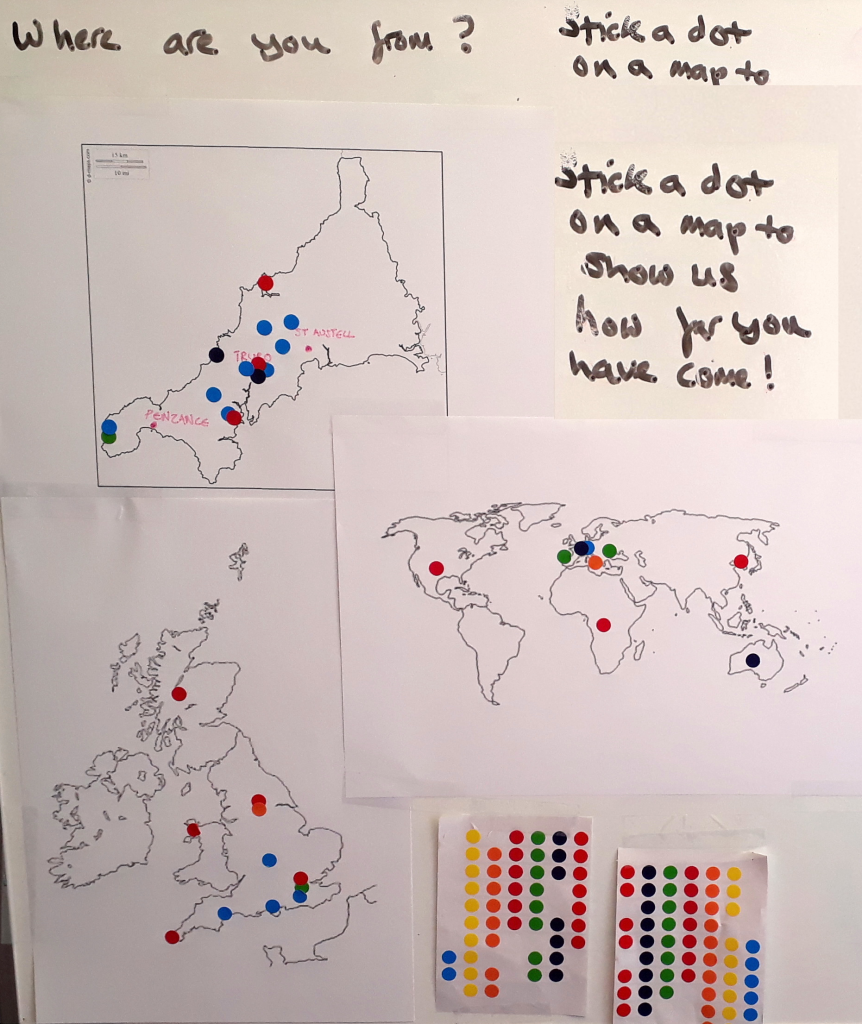
This event was the launch event for the ‘Cornwall Sea to Stars’ project, with a key aim to reach a diverse range of communities. It was therefore important to us to identify where people who visited the trailer came from. We mounted 3 maps on a large whiteboard, along with some coloured dots. The maps were each of a different level of detail: Cornwall only (with key cities marked to help those who were less familiar with map-reading); the UK and Ireland; and the world (Figure 1).
What we found out
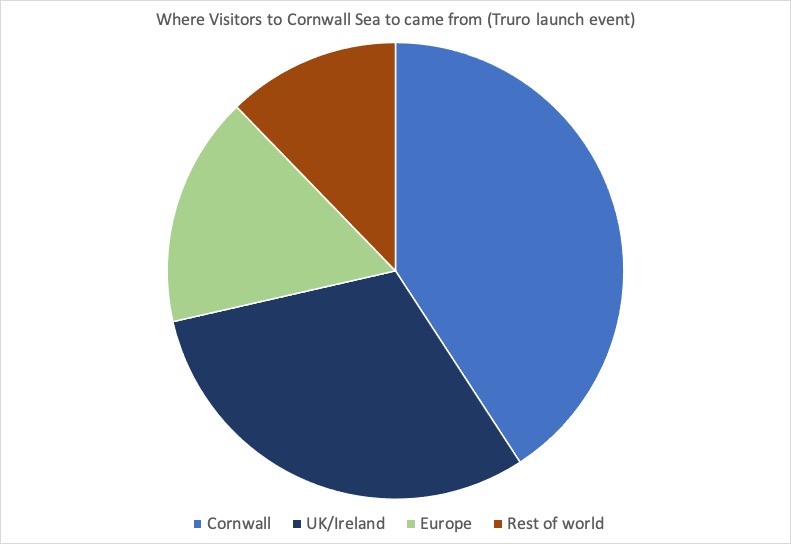
Of the (approximately) 500 people who visited the trailer over the two days, 49 people stuck a sticker on the map. This was lower than we had hoped, but likely due to the location of the board (see ‘Reflections’ below). Based on these data we could estimate a rough distribution of where our visitors came from (Figure 2).
Reflections on using the Geographic location map
This was the most successful evaluation tool that we tested over the two days.
We had hoped to trial moving the whiteboard to a few different locations to optimise the positioning to get the most feedback from visitors. However, due to concerns about the strong winds that were present, the evaluation board was positioned in the shelter of one of the wing panels of the trailer for the majority of the two days.
It is probably unlikely that the distribution of stickers gives a true reflection of the breakdown of visitors from the local area vs further afield. The map in itself was something of a draw, with some people approaching the stand specifically to look at the map. People that had come from abroad appeared to be more willing/interested in sticking a dot on the map; we need to find ways to encourage more locals to place their dots – perhaps by running a tally competition between local towns / cities, or providing a more detailed map of specific areas of Cornwall?
Evaluation is not easy in a drop-in environment and there are physical limitations on where/how it can be conducted, especially in poor weather conditions, where writing/filling in questionnaires is impractical. Stickers seemed to work well and are relatively weather-resistant. The team will review strategy before the next event and adapt materials according to the conditions and audience anticipated.
