Evaluation tool 5 – Geographic location maps
What is this tool?
This simple and inexpensive technique encourages participants to provide their location data in a fun and visual way.
What kind of activities can I evaluate with it?
Geographic location maps are particularly effective for use with interested adults or the general public participating in drop-in sessions and lectures / presentations, but can also be used for online content.
When should I use it?
This tool is best suited to use at the beginning or end of an event.
Geographic location maps at a glance…
| Who: |  |  | ||||
| What: |  |  |  | |||
| Data: |  | |||||
| Time: | ") |  - Medium (1-5 Min)") | ") | |||
| Gain: | Location | Data | ||||
| GLOs: | N/A |
What do I need?
- Pre-prepared large-scale map
- Sticker dots or markers
Let’s get started…
Create a large map of the area relevant to your participants – this might be a neighbourhood, city, country, region, or even the world, depending on what you are doing! The important thing is that the map needs to be sufficiently detailed so that it’s easy for participants to identify ‘their’ part within the map.
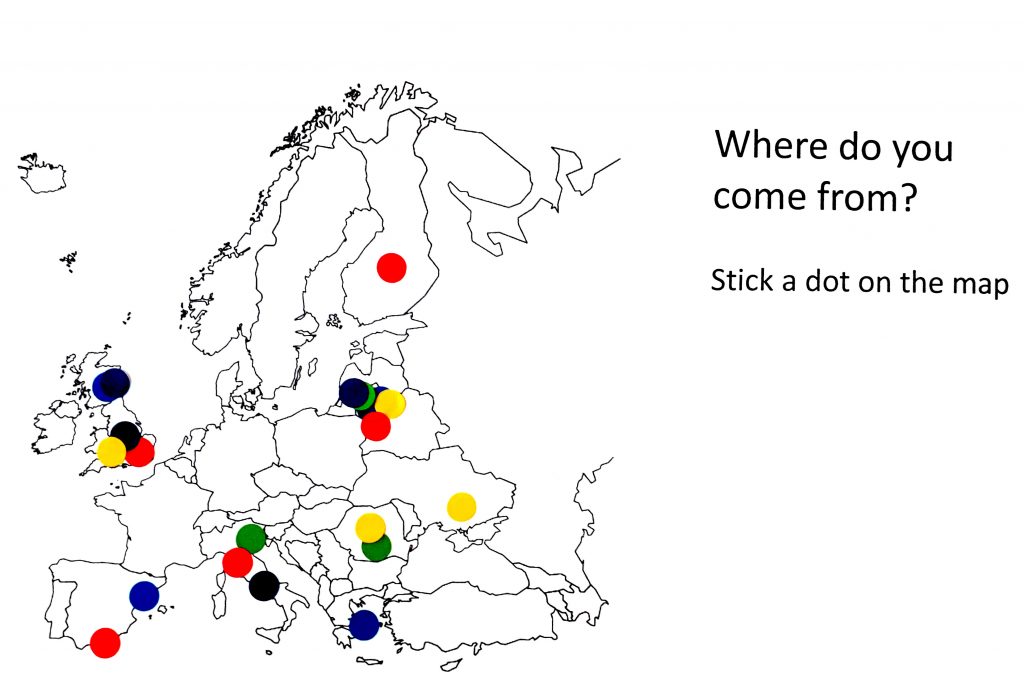
Place the map securely in an accessible area of your event – perhaps at the entrance/exit, or near where food and drink is served. Give each person a small coloured sticker dot and invite them to place it on the map where they come from (see the case study example for images of this tool in action). It becomes a fun, social activity and, for some reason, people like to find themselves on a map, so it encourages participation from those who wouldn’t normally provide such information.
You could also repeat this technique for other similar events and compare the maps – are people from similar backgrounds attending each of your events, or are there differences?
OK, what do I do with my data now?
You now have a visual picture of the geographic distribution of your audience. You can compare this to your intended audience and reflect its makeup: are you reaching the people you want to reach; are there any places which are over- or under-represented? A photograph of the distribution also provides a great visual display for any reporting associated with the event.
Download worksheet
Download the Geographic location maps tool worksheet.
Case study
This Case study uses Tool 5 – Geographic location map to evaluate a drop-in event in a shopping area during an Easter bank holiday weekend.
Back to Tools
