Evaluation Toolkit Case Study (Tool 9 – 3 Words)
The activity
Let’s imagine we’ve developed a website, primarily for teachers to use, that collates useful information about relevant planetary science activities they can do with their students. For ease of discussion later we’ll call this website Europlanet for Schools (EfS). The idea is that on EfS teachers can find exciting opportunities for in-class support, memorable days out, and engaging projects to motivate their students. Teachers can easily search for shows, workshops, debates, challenges, visiting speakers and more.
As part of the development of EfS we want to get teachers’ insights into how it is all working, and where we need to make improvements to the site. The 3 words approach is especially useful in this case as it allows teachers to provide their reactions in their own words in a simple and effective manner – doing it online also means that it fits well with their likely involvement in the site itself.
Note that although this example is hypothetical it builds on existing data and good practice from elsewhere within the sector and is thus a realistic example of how to approach such an issue.
What we would do
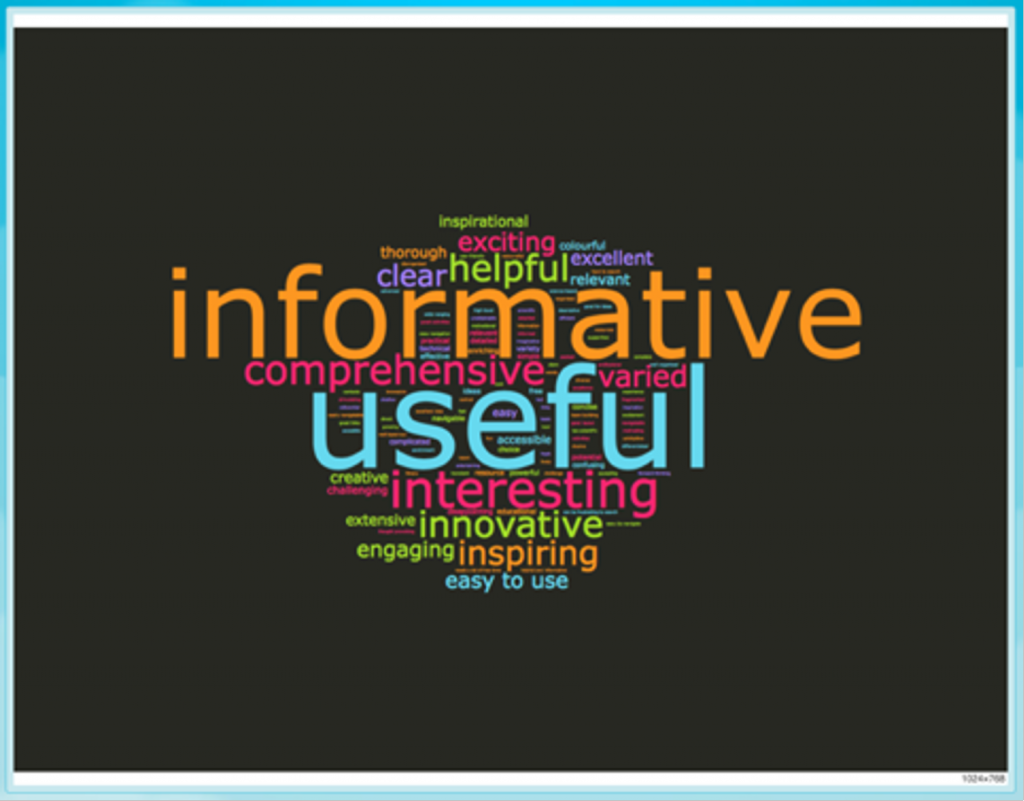
A short pop-up online quiz asks teachers using the website to specify what 3 words they would use to describe EfS. The results are provided on the first worksheet (raw data) in the file qual coding. Using the approach described in word cloud analysis , we firstly create a simple visual map of the words provided by the 100+ teachers who we recruit to respond to the quiz (Figure 1). Within this picture, the larger the text the more common that word is within the dataset (word colours and placement are random).
The word cloud in Figure 1 is a quick and easy way to understand teachers’ common reactions to the website. It is clear that the top two reactions from teachers are that it is ‘informative’ and ‘useful’, with many other positive words also being popular (‘interesting’, ‘comprehensive’, ‘innovative’, ‘inspiring’, ‘helpful’).

Got it! How can I take this further?
Further insights on people’s reactions can be gained by grouping their individual responses into common categories. This process is the basis of all ‘coding’ of qualitative data – dividing it into common themes to help better understand the overall patterns in the responses. We’ve explored this further with the same dataset in our thematic coding tool.
What we could find out
Initially the image in Figure 1 can be used to help update the project team working on the Europlanet for Schools website, to quickly highlight teachers’ main reactions. It could also be presented within an update report to the funder to help demonstrate the success of the current site, and justify further effort on it in the future.
Depending on the aims of the website we may want to tweak some of the content and then repeat this exercise in a few months’ time to see if the responses match more closely to particular goals. For example, if one of the specific aims was to encourage teachers to use practical activities, then the current feedback in Figure 1 doesn’t really include much mention of ‘practical’ elements. For greater emphasis, these could be highlighted more strongly within the website (perhaps with banners or specific news items), or linked to further from other popular resources, or more mention made of ‘practical’ components within existing content throughout many of the other pages. Then after a few months the same ‘3 words’ exercise could be run to see whether these changes have had any influence on users’ perspectives regarding whether ‘practical’ is a word they commonly associate with the site.
Back to Tool 9 – 3 Words page

